PROG102: Functions
This is the second module of the Programming track. By the end of this module, you’ll learn how to:
Write your own R functions
Use functions to hide details (encapsulation)
Use parameters to make functions reusable
Pre-class preparation
Set up the PROG102 module on your computer (see Module Setup and Submission). There you’ll find the guided notes to accompany these recorded lectures.
Lectures
Writing your own functions in R
How functions execute
Default and named parameters
In-class activity
In PROG101 you quantified the hours of exposure a mussel bed experienced to extreme heat or cold in a day. However, to change the site or date you’d have to copy-paste-edit the entire code. In this activity, you’ll parameterize the extreme heat/cold procedures in functions to make them more readable and reusable.
This activity has multiple problems for you to solve, labeled P1, P2, P3, and so on. You’ll find the same labels in prog102.R in your copy of the module.
Writing a utility function
Utility functions are short functions that encapsulate a common task with a useful name. You’re going to write one for converting text to datetime objects in the Alaskan timezone.
Review your code from PROG101. How did you extract the temperature and exposure from the hottest day? Copy-paste the code into prog102.R (P1). Make a mental note of the line of code that creates a datetime object (which R calls POSIXct).
Recall functions have five parts:
- The function’s name
- The keyword
function - Parameters, enclosed in parentheses
- The function’s body, enclosed in curly braces
- A return for the output
Fill in the blanks below to write the Alaskan datetime utility function (P2). Its input should be a text string representing a datetime (e.g., “2020-02-02 16:00”). The output should be a POSIXct object for that datetime in the Alaskan timezone. Make sure you choose names for the function and parameters that make it easy to read! Each set of ‘???’ corresponds to one of the five parts of a function.
??? <- ???(???) {
  ???
  return(???)
}
You’ll use this utility function in the next section, where you’ll write functions for extracting temperatures, exposures, and datetimes.
Extracting data
First, we’ll visualize temperature and exposure for two different sites on two different dates by copy-paste-edit.
Make a copy of your code from P1 and edit it to plot the temperature and exposure for “Aialik” on 2012-06-01 (P3).
Make a copy of your code from P3 and edit it to plot the temperature and exposure for “Harris” on 2016-04-05 (P4).
Compare your solutions for P3 and P4 - what variables changed (P5)? The variables that change values for different inputs are what you want to pick for your function’s parameters.
When converting code to a function, the process of changing fixed variables into flexible parameters is called parameterization.
You’re going to convert this code into a function. Remember that functions should make our code easier to read, which means the function and parameters should have descriptive names. What you would pick for the temperature extraction function and parameters’ names (P6)?
When parameterizing a function, you’re usually going from a specific case to a more general purpose tool. That’s the whole point of reusable functions! So your parameter names will often be more general versions of the variable names used in the specific case.
Writing extraction functions
Using the function and parameter names you picked, write a function (with all five parts!) that extracts the temperature for a given site and date. This is where you’ll use the utility function you wrote above. Fill in the blanks in the code below to write your temperature extraction function (P7).
??? <- ???(???, ???, ???) {
  ??? <- your_utility_function_name_here(???)
  ??? <- your_utility_function_name_here(???)
  ???
  return(???)
}
Now you’ll do the same for extracting exposure and datetimes. Make a copy of your solution to P7, and edit it to create exposure and datetime extraction functions (P8). As always, remember to choose helpful function names!
Take a screenshot of the code for your temperature extraction function and annotate the screenshot (e.g. in Powerpoint or Keynote) to label the five parts of your function. Export your annotated version as a JPEG called “annotated_function.jpg” and add it to your copy of the module repository (P9).
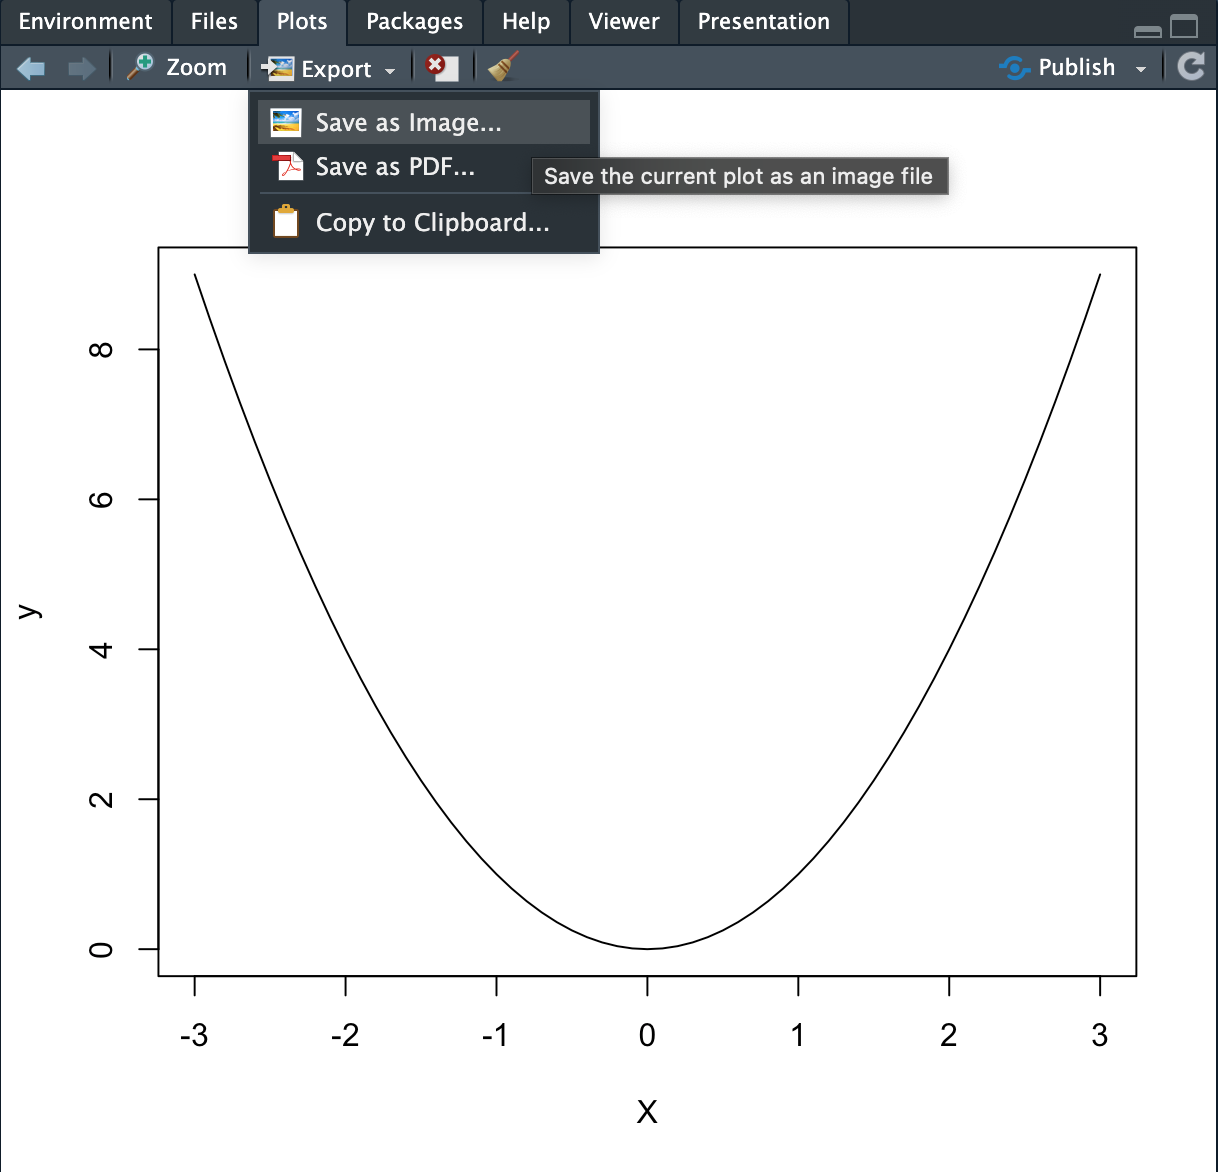
Now let’s test your functions. Extract the temperature, exposure, and datetime for site Nuka_Pass on July 1, 2018 and visualize them (P10). It may help to review as.POSIXct() and plot_kefj() from PROG101. Save a copy of the plot as “nuka_pass_2018-07-01.png” in this repo (P11). There’s an option to export a plot as an image from the Plots pane (see screenshot below).
By writing the three extraction functions, you’ve encapsulated the logic for extracting data. Compare the code you wrote to create the plot in this module to the code you wrote in PROG101. Qualitatively, how do they compare? Which one is easier to read and why? (P12)
Recap and next steps
In this module you learned how to make your code more readable and reusable by writing functions.
PROG103 is a complementary module to this one. There you’ll learn how to write branches (deciding what to do based on a condition) and loops. So while here we were still focused on individual sites and dates, in PROG103 you’ll learn how to loop over multiple sites and dates.
Fill out the PROG102 reflection to complete this module. Well done!